The first project at Metis involved using Python and Pandas to examine the turnstile data available online from the Metropolitan Transportation Authority. Doing some introductory data cleaning and analysis, we were expected to determine the MTA ridership of different stations and over different time periods.
Background
The theoretical enduser is an outreach program, WomenTechWomenYes (WTWY), dedicated to increasing the participation of women in technology. WTWY hosts an annual summer gala and is looking for suggestions as to how to better populate that event with passionate attendees. Gala tickets are sent via email to interested parties, and WTWY solicits email addresses at MTA subway stations. As such, they need to know how to optimize the placement of street teams.
Methodology
The MTA turnstile data is readily available but needed several cleaning steps to remove duplicate entries, turnstile counter errors, etc. The MTA publishes data on weekly ridership at each station, which served as a benchmark against which we measured our analysis. Provided that the stations we determined to have the most traffic matched those according to the MTA, we concluded that our cleaning and subsequent analysis was successful.
Analysis
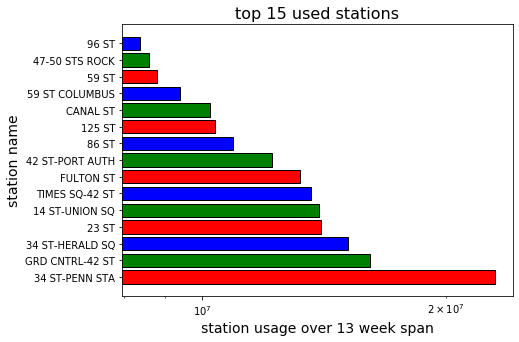
Since the fictitious gala is scheduled in the beginning of summer, we chose to examine a 13-week span from the beginning of April 2019 to the end of June. The top 15 stations in ridership over that span, not distinguishing between entries and exits, are shown in below.
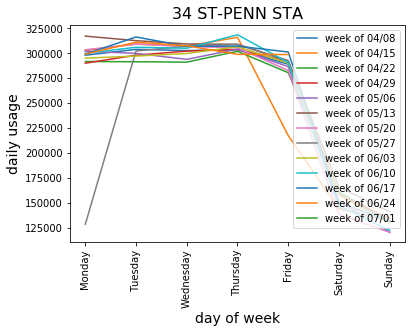
Broken down into weeks, we noted a few trends for one of the busiest stations, 34th Street–Penn Station:
- weekday ridership was generally uniform
- weekend ridership numbers were consistently lower
- holidays that fell on weekdays led to reduced ridership (Memorial Day, Good Friday)
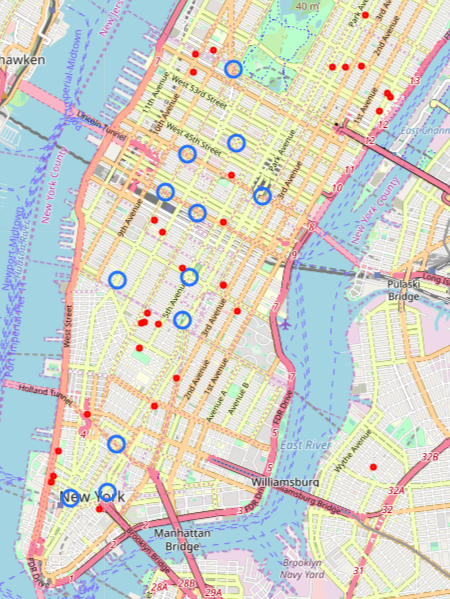
We then used the longitude and latitude of stations also available from the MTA website to plot the locations of the busiest stations. As we can assume WTWY has limited resources, it wouldn’t make sense to send them across the five boroughs.
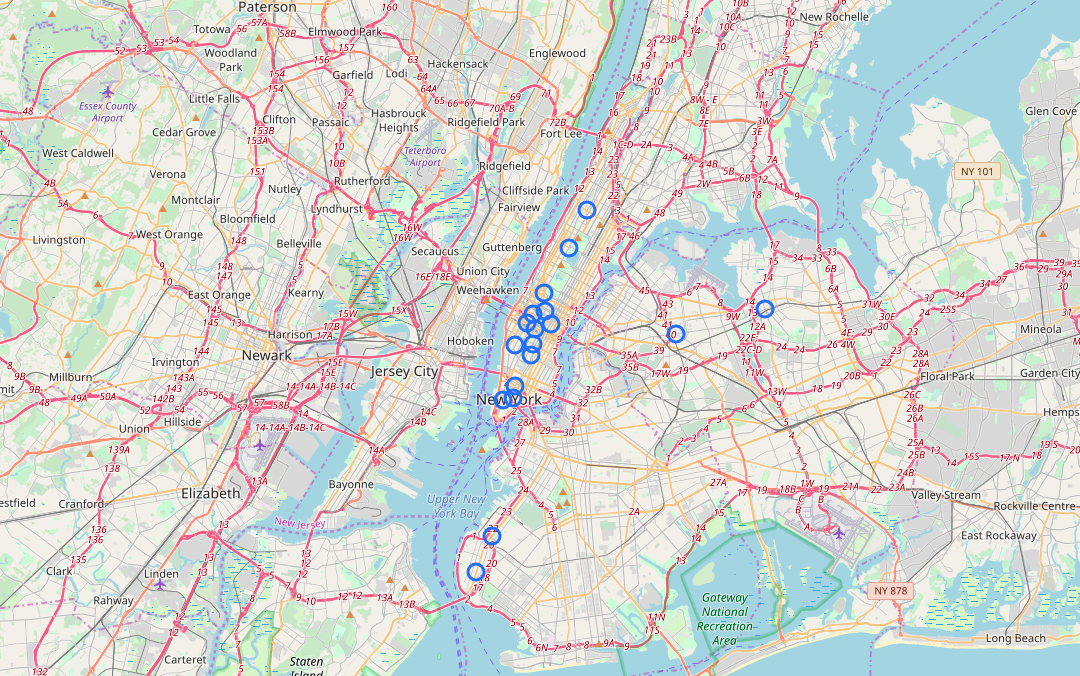
We noted then that only one of the top stations, 86th St, was not located on Manhattan. We then further explored these top locations by examining their neighboring colleges and universities, address data which are available from NYC Open Data. As WTWY is a relatively new organization, it seems beneficial to increase brand awareness by targeting subway stations near colleges and universities.
Conclusions
We ended up recommending the stations listed in the top 15. Not knowing how much manpower WTWY has, we felt it better to give broad recommendations. We thus suggested they stick to weekdays, as weekday ridership outpaces weekends. We did note that holidays should be avoided as traffic decreases.
Each of the seven groups presented their results, and it was certainly interesting to see how other groups approached the problem, specifically how each moved beyond the MTA data to better gauge which stations to recommend. Others looked at demographics near stations to find regions with people who work in the tech sector or regions with higher earnings in hopes of finding donors for WTWY.
As this is a learning exercise, I’ll add a ‘what I learned’ section. As the analysis time is limited, we’d have done better if we first chose a time frame to analyze and stuck with it - remembering to save the raw data ::insert pickle emoji once it’s available:: because, while we didn’t anticipate it, we had to go back to the beginning many more times than was efficient.