The second project was one of our own choosing. I (finally) settled on trying to model the rental rates of Airbnb listings in Toronto using the details of the rental unit. As someone who frequently uses Airbnb, I am quite familiar with the website and its offerings. Choosing the location was easy - having spent the last six years in Toronto, I know the city well, which in theory would come in handy when analyzing.
Background
The population of Toronto has been on the rise, evidenced by new residential construction at seemingly every corner. Still, Toronto remains a sellers’ market as average sales prices also have been increasing. Also on the rise: tourism. Metrics measuring tourism also show that Toronto should continue to expect a large influx of tourists this year. If you have a cool 800,000 CAD lying around, purchasing an investment property to take advantage of these short-term visitors might be something you’re considering. But how do you decide what condo to purchase? Is it better to prioritize listing location or living space?
Methodology + Preliminary Analysis
I started with the Inside Airbnb database from December 2019. From there, I used Selenium to check the database details against the currently-listed information on Airbnb - this was to 1) make sure the listing was still available, 2) verify that the price per night was in USD and for a single occupant. I started with over 1200 listings before removing those with NaNs in neighborhood, bedrooms, bathrooms, beds, and review scores rating. To clarify, there exists a distinction between bedrooms and beds because listings may place multiple beds in a single bedroom to try to accommodate more people - a bunkbed in a bedroom counts as one bedroom but two beds. I then further limited only to listings that offered the entire home/apartment as opposed to a shared space, then further to include only apartments and condos; that is, excluding full homes, guest houses, etc. Finally, I limited to short-term rentals i.e., those that accepted minimum bookings < 31 days.
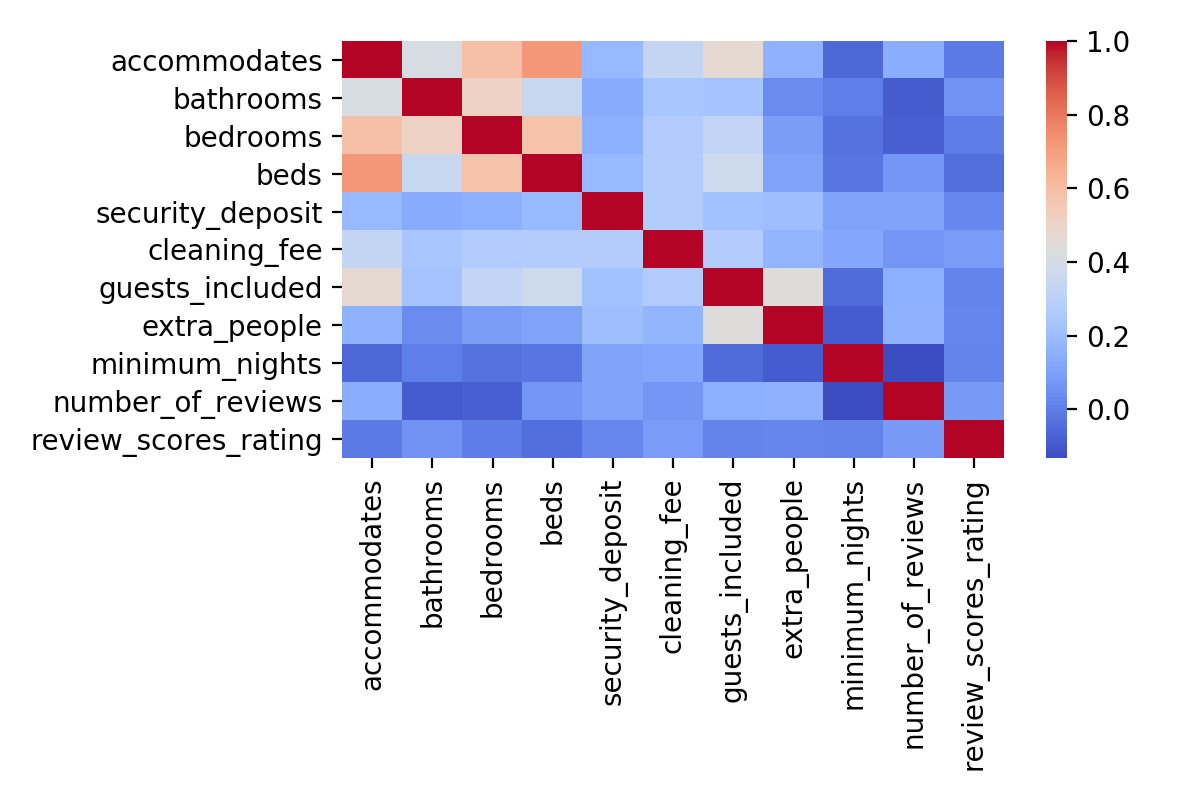
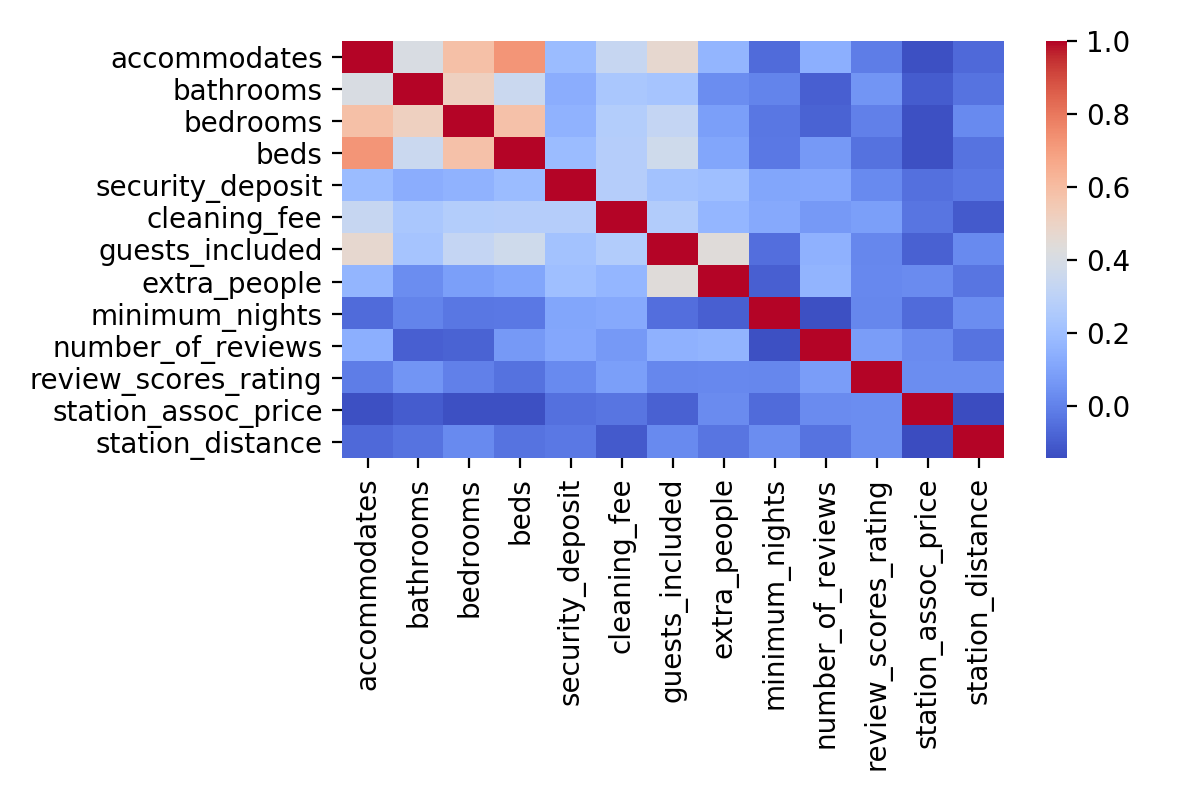
My final ‘cleaned’ database included 11 numeric features from which I wanted to model the listing price: accommodates, bedrooms, bathrooms, beds, security deposit, cleaning fee, guests included, price per extra guest, minimum number of nights, number of reviews, and review scores rating. I checked first the correlation between any of my features (read: independent variables), shown below. It indicated an understandable correlation between bedrooms, accommodates, beds, and bathrooms as well as possibly between guests included and price per extra guest.
Using 5-fold cross validation of a 60-20-20 train-validate-test split, the resulting linear regression was not very successful: R^2 = 0.222 and average mean absolute error = 23.20 (24% of mean price) for the validation sets. So now what?
I thought back to things I’d consider when renting an Airbnb for a weekend: after limiting to the desired unit size, I’d further narrow the options by location. When traveling to an urban destination like Toronto, I’d research the neighborhoods and prioritize proximity to public transit because I wouldn’t be renting a car to get around.
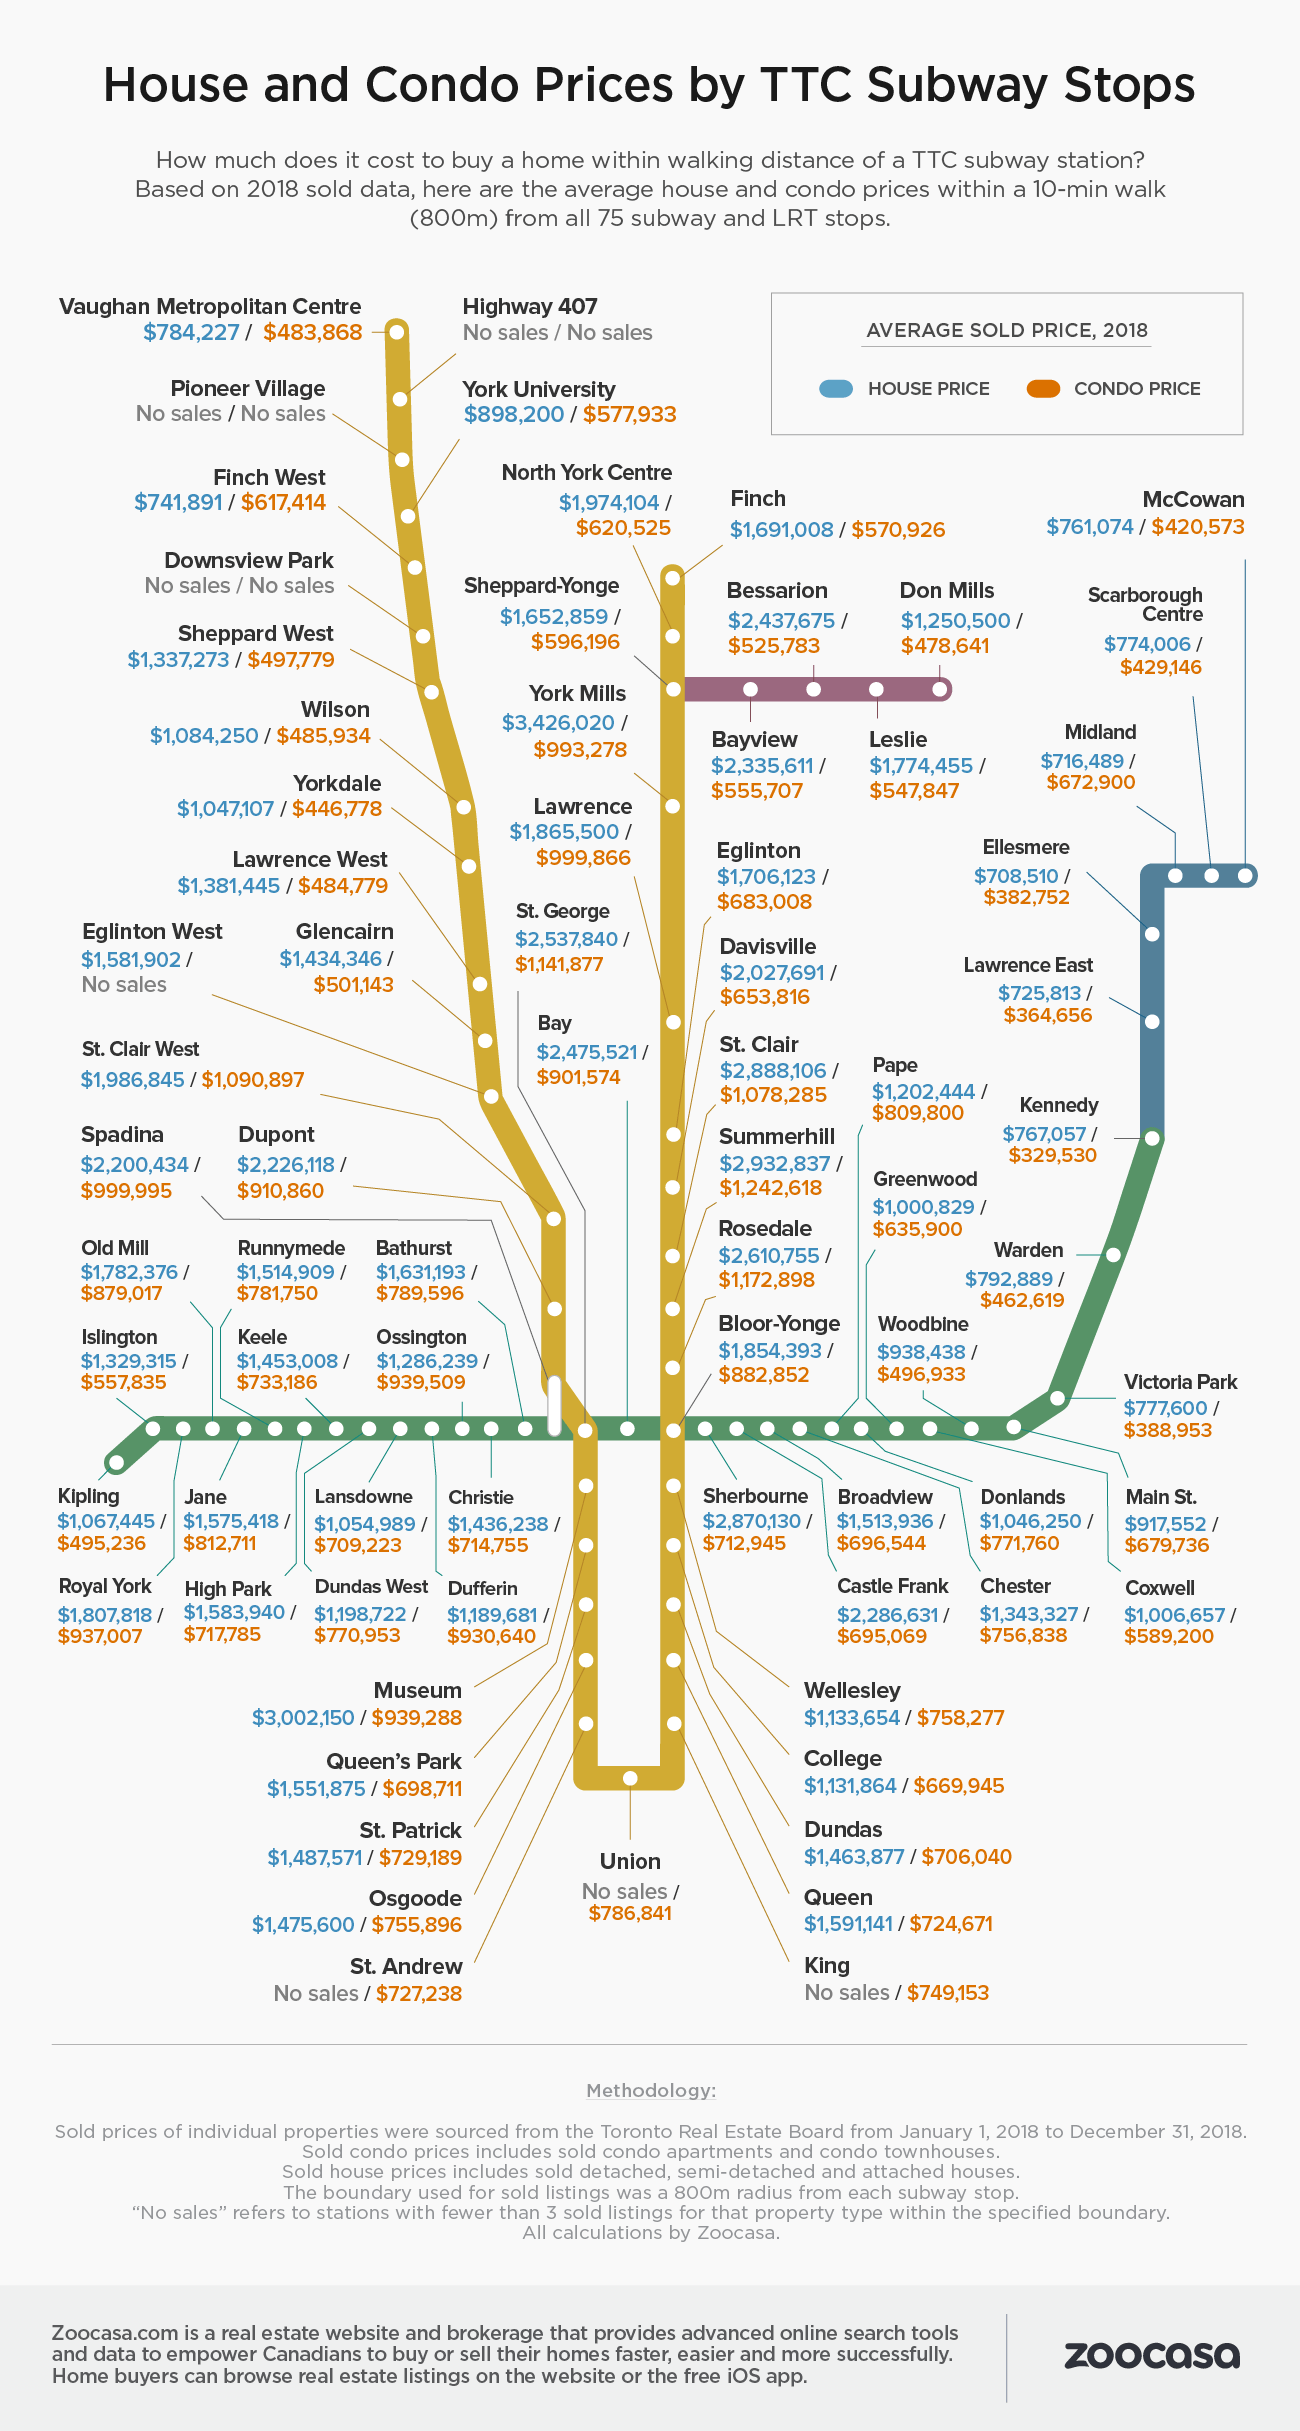
Toronto public transit is run by the TTC, the Toronto Transit Commission, and includes 5 subway lines, streetcars, and numerous bus routes. Station and stop locations are available online. For simplicity, I limited to just the 75 subway stations and calculated the distance between the Airbnb listing and the nearest subway stop. I also utilized a popular infographic that appears in local blogs each year: Housing and Condo Prices by TTC Subway Stops, which lists the average condo prices within a 0.5 mi radius of that subway station. I thus found the closest subway stop and then the associated price for each, yielding two additional independent variables that weren’t shown to add additional multicollinearity.
Again using 5-fold cross validation of a 60-20-20 train-validate-test split, the resulting linear regression was again not very successful: R^2 = 0.203 and average mean absolute error = 23.42 for the validation sets.
Results
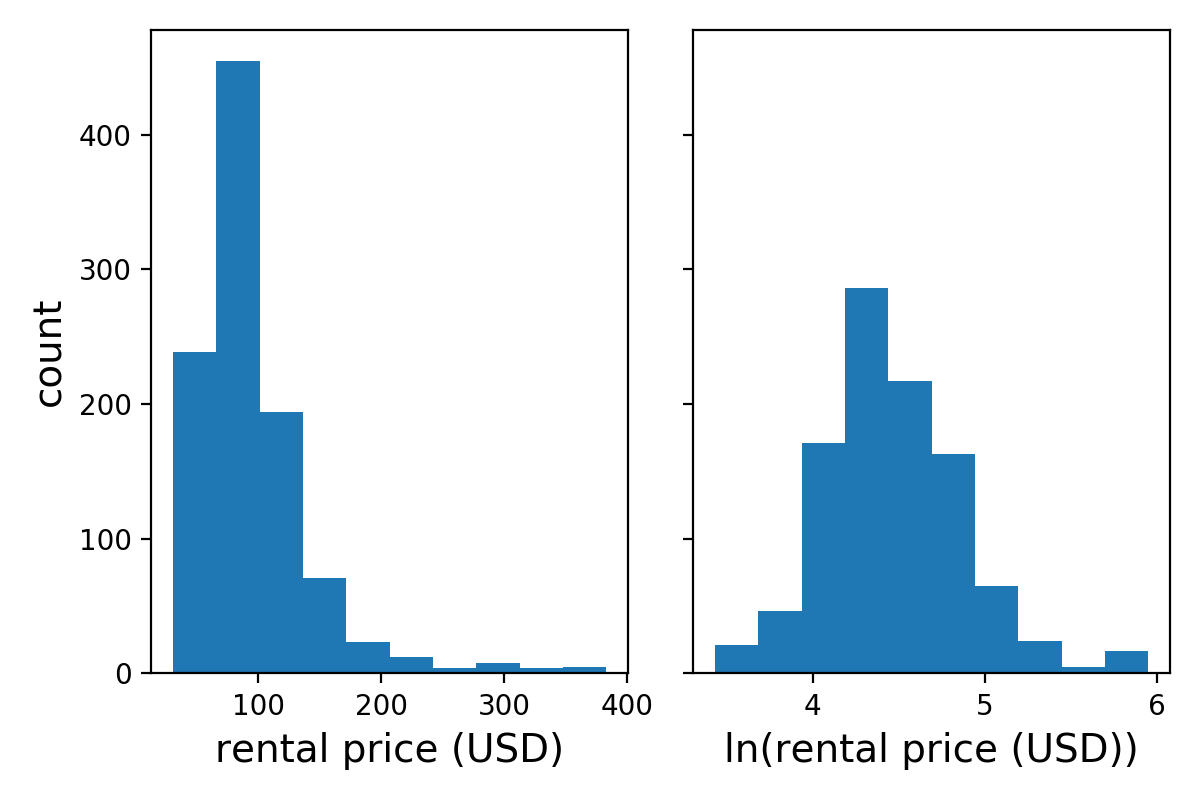
Taking the natural log transformation of the dependent variable, listing price, helped shift the distribution to something more normal. This had an impact on the linear regression: R^2 = 0.224 and average mean absolute error = 0.25, though the latter is difficult to compare with the previous linear regression results.
I was still working with all 13 columns despite seeing some evidence of multicollinearity. I then used the sckikit-learn linear regression models that included ridge and LASSO regularization techniques to try to reveal any inconsequential features. Using these necessitated standardization of the independent variables, which was welcome as the station-associated pricing was on the order of 1000000 while the unit features were ~1. Of course, this made interpreting the coefficients more complicated on the back end. As suspected, beds and number of guests included were superfluous. Minimum number of nights also dropped out, leaving me with 10 features.
The metrics to compare the different model now using the test set are shown below. Clearly none of the models were overwhelmingly successful.
| metric\model | no TTC | with TTC | ln(with TTC) | ln(with TTC), LASSO | ln(with TTC), ridge |
|---|---|---|---|---|---|
| mean absolute error | 23.68 | 23.42 | 0.25 | 0.25 | 0.25 |
| mean R^2 | 0.194 | 0.203 | 0.224 | 0.226 | 0.221 |
Conclusions
So, did the model work? Not according to the resulting R^2 score. Granted it is a learning process, so we can still glean a few insights:
- the unit details (number of bedrooms, bathroom, and people it accommodates) were positively correlated with rental price
- station distance was negatively correlated with rental price, so being further from the nearest station led to lower pricing
Still, why wasn’t this more accurate? Maybe including TTC streetcar stops would have helped, but there are hundreds of these and would add a lot of complication to the analysis. Maybe I needed more data - Airbnb listings in Toronto are concentrated in the downtown core so geographical outliers would not be approximated well. Or maybe I was trying to predict the wrong thing - technically, owners can price their units at whatever price they want. I’d assume they’d look at nearby comps to gauge if they’re priced competitively, much like real estate sales, but in the end this is a rental price, not a sale. It may have been more successful to consider trying to calculate a value weighted by the number of bookings.
For this week’s ‘what I learned’ section, I think it’s something more abstract: it’s easy to get bogged down in the details, trying to plow through the analysis and get to the results. In the vein of ‘seeing the forest for the trees,’ perhaps I needed to take time to step back from the brute force analysis and think about the overall goal.